Contents
Double Pendulum Simulation
Author: Tyler Jones Contact: tjjones6@wisc.edu Institution: University of Wisconsin-Madison Date: 05.27.2024
Description: This code simulates a double pendulum using RK45 (ode45) as the chosen numerical scheme. The pendulum's trajectory is then mapped onto an animation figure. Finally, plots of angular evolution, angular velocity evolution, and respective phase spaces are generated.
clear all; close all; clc;
User Input
Define Parameters
g = 9.81;  % Acceleration due to gravity (m/s^2)
L1 = 1.0;  % Length of the first pendulum arm (m)
L2 = 1.0;  % Length of the second pendulum arm (m)
m1 = 1.0;  % Mass of the first pendulum bob (kg)
m2 = 1.0;  % Mass of the second pendulum bob (kg)

% Initial Conditions
theta1_0 = pi/2;  % Initial angle of the first pendulum (radians)
theta2_0 = pi/2;  % Initial angle of the second pendulum (radians)
omega1_0 = 0;      % Initial angular velocity of the first pendulum (rad/s)
omega2_0 = 0;      % Initial angular velocity of the second pendulum (rad/s)

% Time Settings
tspan = [0 25];  % Extend the time span for simulation (seconds)
Numerical Integration using ODE45
options = odeset('RelTol', 1e-6, 'AbsTol', 1e-6);
[t, y] = ode45(@(t, y) doublePendulumODE(t, y, g, L1, L2, m1, m2), tspan, [theta1_0, omega1_0, theta2_0, omega2_0], options);

% Extracting and Converting Data
theta1 = y(:, 1);
theta2 = y(:, 3);

x1 = L1*sin(theta1);
y1 = -L1*cos(theta1);
x2 = x1 + L2*sin(theta2);
y2 = y1 - L2*cos(theta2);
Animation
Initialize an array to store frames for the animation
frames = [];

% Create a figure for the animation (The figure will initially display as empty)
animationFig = figure('units','normalized','Position',[0.1 0.1 .8 .8]);
myfigpref

% Storing animation data
% myWriter = VideoWriter('DoublePendulumAnimation.mp4', 'MPEG-4');
% myWriter.FrameRate = 30;
% open(myWriter);

% Set manual axes limits for animation
animationLimits = [-2.5 2.5 -2.5 1];  % Adjust as needed

% Set initial axes limits
axis(animationLimits);

for i = 1:length(t)
    % Plot the trajectory
    plot(x2(1:i), y2(1:i), 'Color',[0.1 0.1 0.1 0.2])
    if i > 20
        plot(x2(i-20:i), y2(i-20:i), '-r')
    end

    % Update the position of the pendulum bobs and rods in the animation plot
    plot([0, x1(i)], [0, y1(i)], 'k', 'LineWidth', 2);  % Rod for Pendulum 1
    hold on;
    plot([x1(i), x2(i)], [y1(i), y2(i)], 'k', 'LineWidth', 2);  % Rod for Pendulum 2
    plot(x1(i), y1(i), 'bo', 'MarkerSize', 10, 'MarkerFaceColor', 'b');  % Mass for Pendulum 1
    plot(x2(i), y2(i), 'ro', 'MarkerSize', 10, 'MarkerFaceColor', 'r');  % Mass for Pendulum 2
    fig_xytit('x-axis','y-axis',['Double Pendulum Animation - Time: ', num2str(t(i), '%.2f'), 's'])

    % Set initial y-axis limits
    ylim(animationLimits(3:4));
    xlim(animationLimits(1:2));

    % Capture the current frame for the animation
    frame = getframe(animationFig);
    frames = [frames, frame];
%     writeVideo(myWriter,frame);

    % Clear the previous frame in the animation plot
    if i < length(t)
        cla(animationFig);
    end
end

% Close the animation figure
% close(animationFig);
% close(myWriter)

% Display the animation
% figure('units','normalized','Position',[0.1 0.1 .8 .8])
% movie(frames, 1, 30);  % Play the animation at 30 frames per second
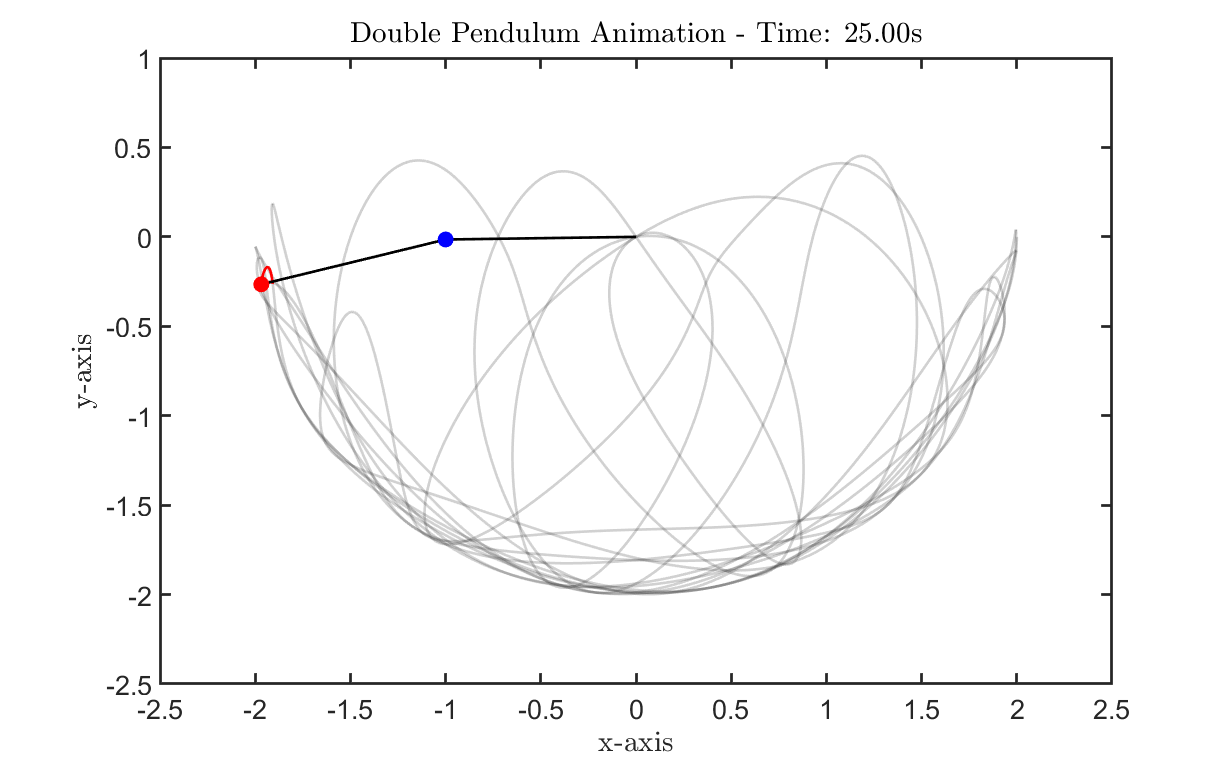
Plotting Results
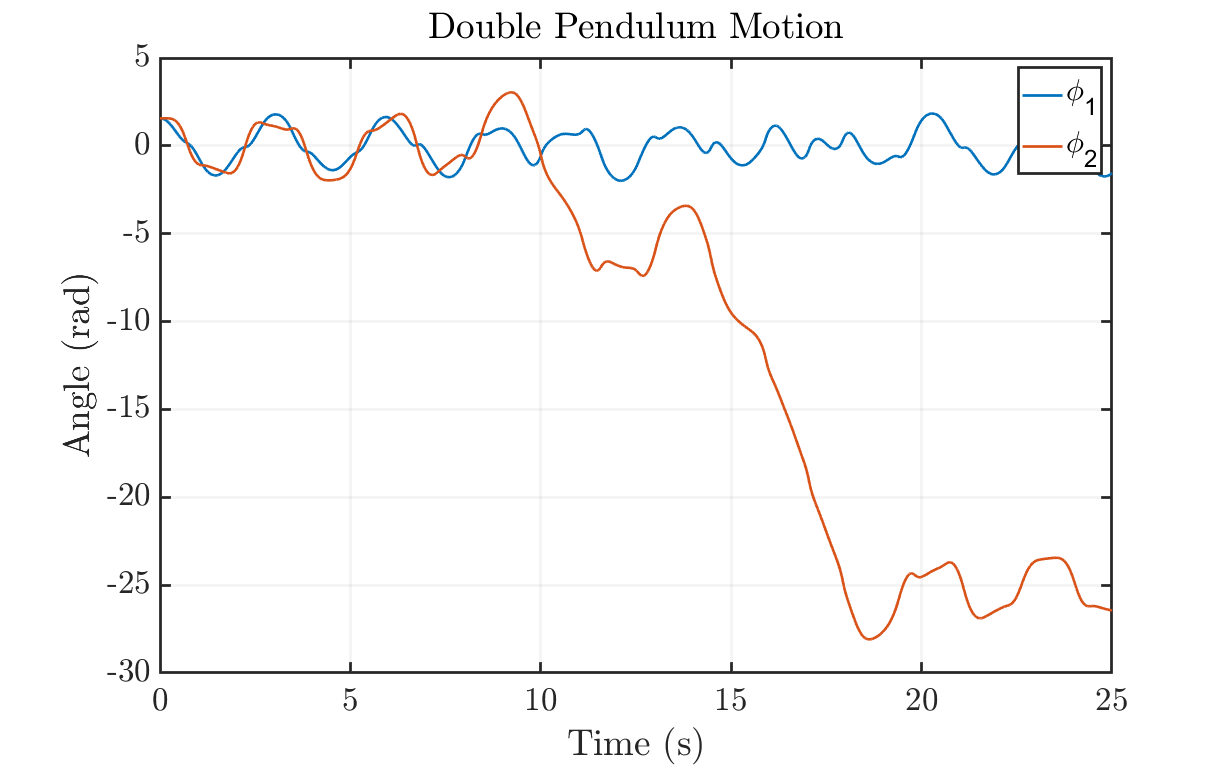
Plot angle evolution
figure('units','normalized','Position',[0.1 0.1 .8 .8])
hold on; grid on;
myfigpref
plot(t, y(:, 1), t, y(:, 3))
fig_xytit('Time (s)', 'Angle (rad)', 'Double Pendulum Motion');
legend('\phi_1', '\phi_2');
hold off;

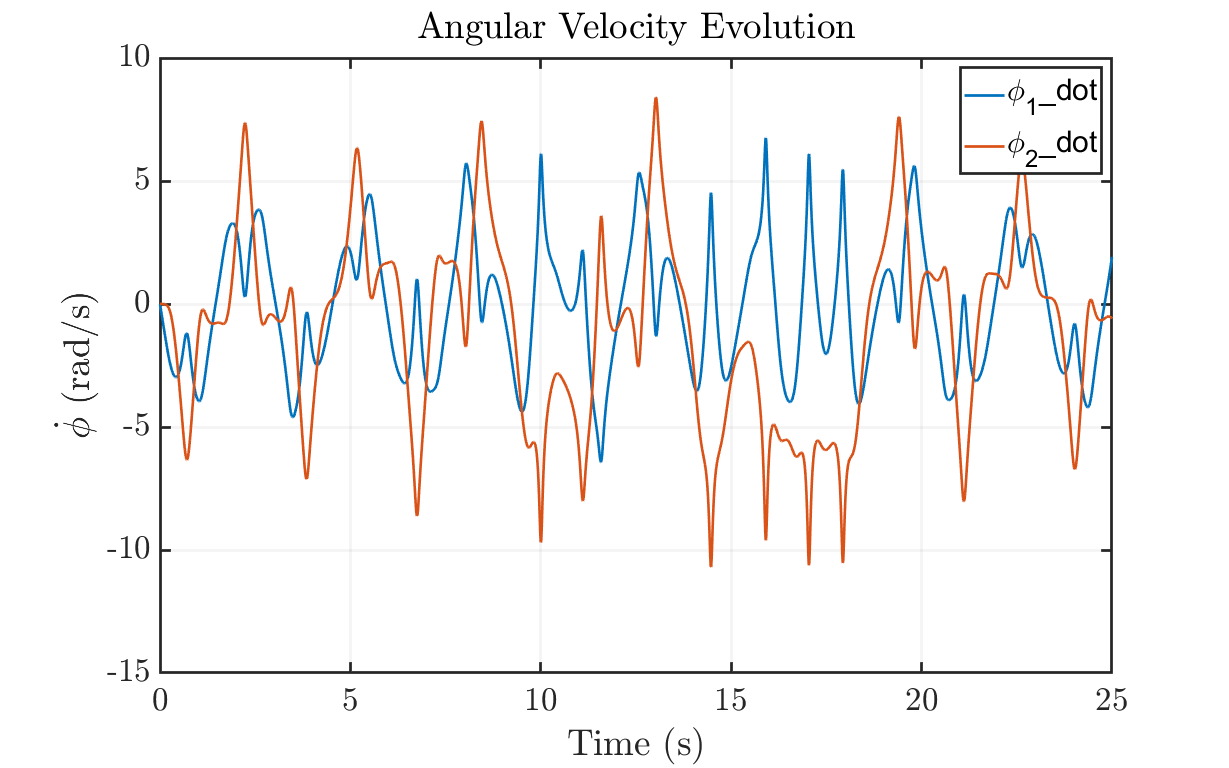
% Plot angular velocity evolution
figure('units','normalized','Position',[0.1 0.1 .8 .8])
hold on; grid on;
myfigpref
plot(t, y(:, 2), t, y(:, 4))
fig_xytit('Time (s)', '$\dot{\phi}$ (rad/s)', 'Angular Velocity Evolution')
legend('\phi_1\_dot', '\phi_2\_dot');
hold off;

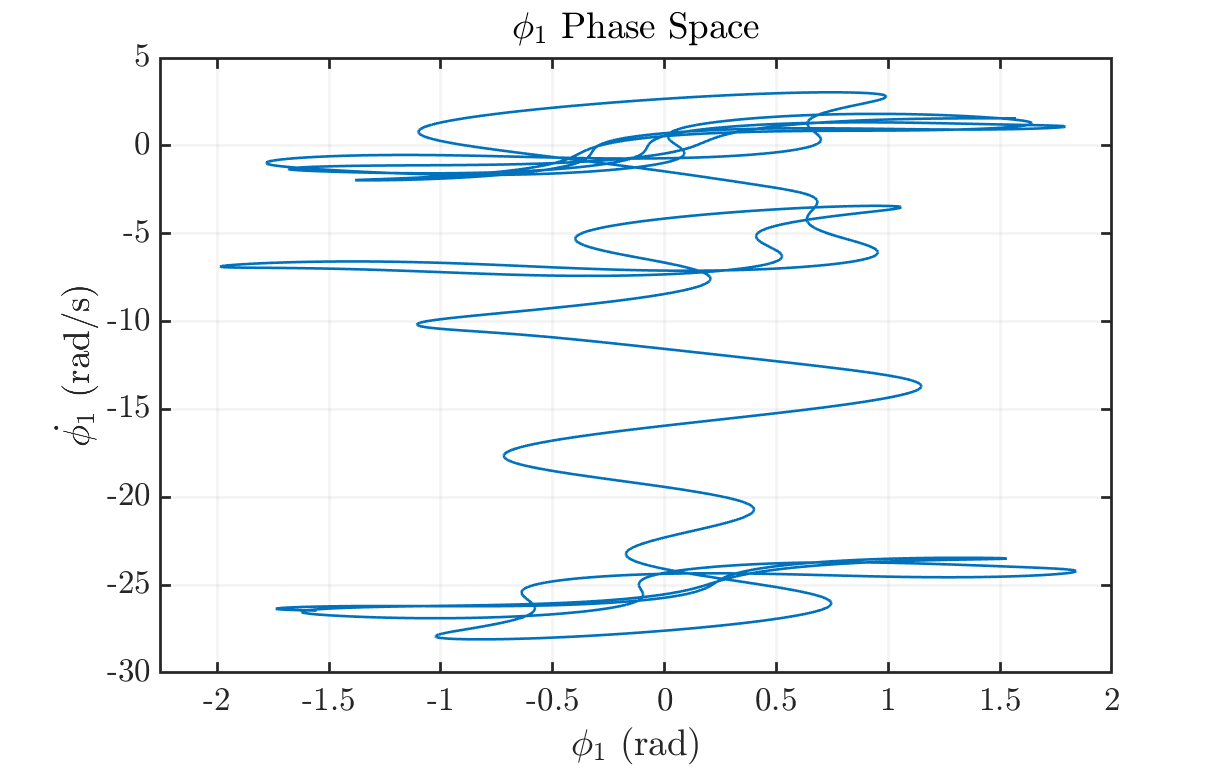
% Phase Space of Pendulum 1
figure('units','normalized','Position',[0.1 0.1 .8 .8])
hold on; grid on; axis padded;
myfigpref
plot(y(:,1), y(:,3))
fig_xytit('$\phi_1$ (rad)', '$\dot{\phi_1}$ (rad/s)', '$\phi_1$ Phase Space')
hold off;

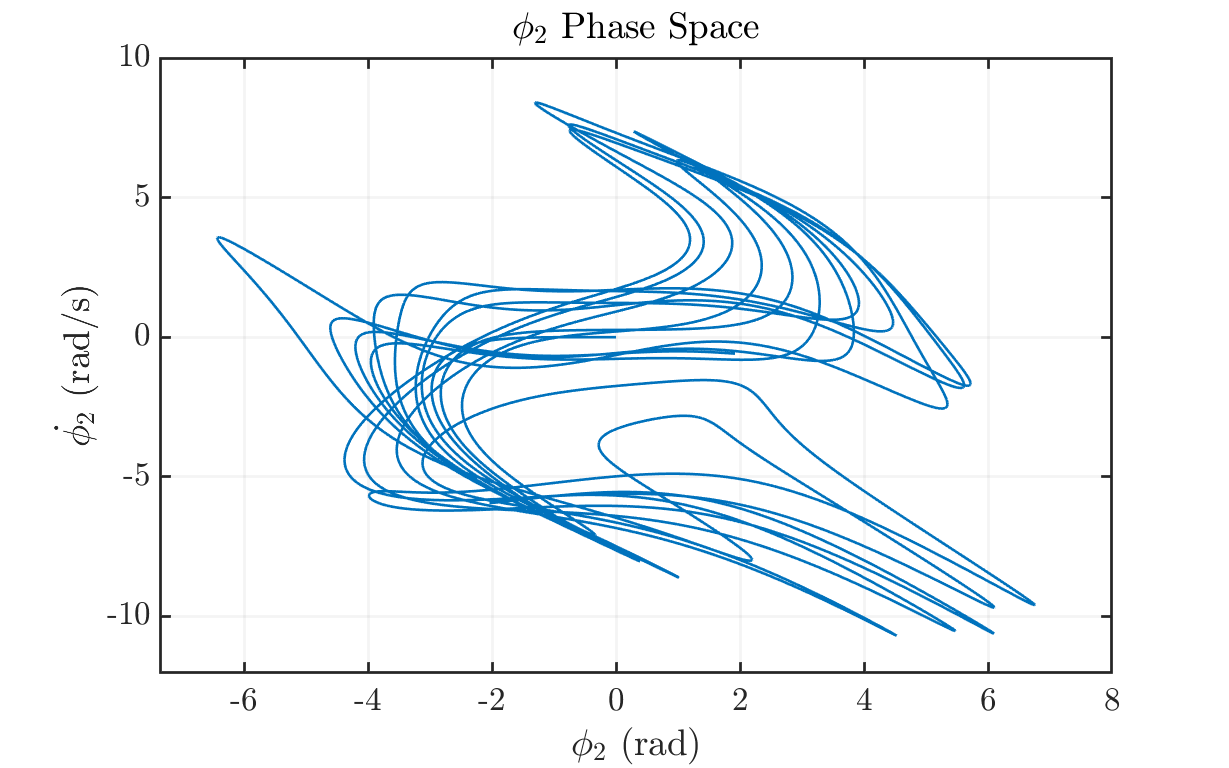
% Phase Space of Pendulum 2
figure('units','normalized','Position',[0.1 0.1 .8 .8])
hold on; grid on; axis padded;
myfigpref
plot(y(:,2), y(:,4))
fig_xytit('$\phi_2$ (rad)', '$\dot{\phi_2}$ (rad/s)', '$\phi_2$ Phase Space')
hold off;
Define the function for the double pendulum ODEs
function dydt = doublePendulumODE(~, y, g, L1, L2, m1, m2)
    % Unpack the state variables
    theta1 = y(1);
    omega1 = y(2);
    theta2 = y(3);
    omega2 = y(4);

    % Equations of motion for the double pendulum
    dydt = zeros(4, 1); % empty row vector
    dydt(1) = omega1;
    dydt(2) = (-g * (2 * m1 + m2) * sin(theta1) - m2 * g * sin(theta1 - 2 * theta2) - 2 * sin(theta1 - theta2) * m2 * (omega2^2 * L2 + omega1^2 * L1 * cos(theta1 - theta2))) / (L1 * (2 * m1 + m2 - m2 * cos(2 * theta1 - 2 * theta2)));
    dydt(3) = omega2;
    dydt(4) = (2 * sin(theta1 - theta2) * (omega1^2 * L1 * (m1 + m2) + g * (m1 + m2) * cos(theta1) + omega2^2 * L2 * m2 * cos(theta1 - theta2))) / (L2 * (2 * m1 + m2 - m2 * cos(2 * theta1 - 2 * theta2)));
end

Reference Functions for Plotting
function myfigpref
    set(0, 'DefaultAxesFontSize', 20);
    set(0, 'DefaultAxesLineWidth', 2);
    set(0, 'DefaultLineLineWidth', 2);
    set(0, 'DefaultPatchLineWidth', .7);
    set(0, 'DefaultLineMarkerSize', 6);
    grid on;
    box on;
    h = gca;
    h.TickLabelInterpreter='latex';
    h.MinorGridAlpha=0.05;
    h.GridAlpha=0.05;
    h.FontSize=25;
    h.LineWidth=2;
    h = gcf;
    h.Color = [1,1,1];
end

function fig_xytit(xlab, ylab, tit)
    if nargin < 3
        tit = '';
    end
    xlabel(xlab, 'interpreter', 'latex');
    ylabel(ylab, 'interpreter', 'latex');
    title(tit, 'interpreter', 'latex');
end