Contents
Duffing Equation (Phase Space Solution Trajectory)
Tyler Jones tjjones6@wisc.edu 04.10.2024
clear all; close all; clc

% Parameter Library
alpha = -1;
beta = 0.25;
gamma = 2.5;
omega = 2;
delta = 0.1;
Simulation and Visualization Loop
% Rewritten
x_dot = @(x,v) v;
v_dot = @(x,v,t) gamma*cos(omega*t) - delta*v - alpha*x - beta*x.^3;

% Solve Duffing Equation via ODE45
Duff_Eq = @(t, Y) [Y(2); gamma*cos(omega*t) - delta*Y(2) - alpha*Y(1) - beta*Y(1).^3];
IC = [1,0];
tspan = [0,50];
[t, Y] = ode45(Duff_Eq, tspan, IC);

% ---
% Generate mesh
% ---
bound = 6;
xx = linspace(-bound,bound,30);
yy = linspace(-bound,bound,30);
[XX,YY] = meshgrid(xx,yy);
UU = x_dot(XX,YY);
VV = v_dot(XX,YY,t(1)); % Only first time step

% Begin time stepping
figure('units','normalized','Position',[0.1 0.1 .8 .8])

% myWriter = VideoWriter('DuffingEquationPhaseSpace.mp4', 'MPEG-4');
% myWriter.FrameRate = 30;
% open(myWriter);

for i = 1:length(t)
    clf;

    % Update VV (Due to forcing term)
    VV = v_dot(XX,YY,t(i));

    % Phase Portrait
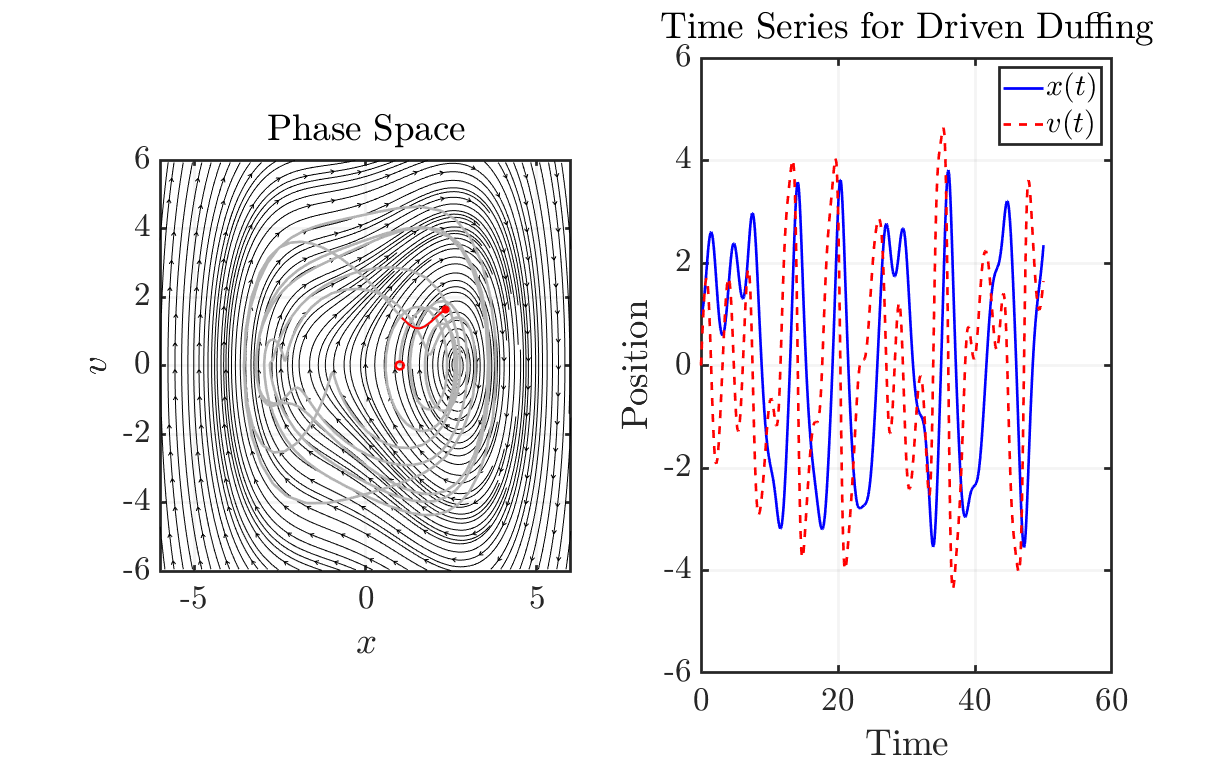
    subplot(1,2,1)
    hold on
    myfigpref
    fig_xytit('$x$','$v$','Phase Space')
    % quiver(XX,YY,UU,VV,'Color',[0.7,0.7,0.7],'LineWidth',1.5);
    strmslice1 = streamslice(XX, YY, UU, VV, 5);
    set(strmslice1, 'Color', 'black','linewidth',0.5);
    plot(Y(1:i,1),Y(1:i,2),'Color',[0.7,0.7,0.7])
    plot(IC(1),IC(2),'or')
    if i >= 11
        plot(Y(i-10:i,1),Y(i-10:i,2),'r','LineWidth',1.5) % Plot the solution trajectory
    end
    if i < 11
        plot(Y(1:i,1),Y(1:i,2),'r','LineWidth',1.5) % Plot the solution trajectory
    end
    plot(Y(i,1),Y(i,2),'r*')
    axis equal
    axis([min(xx) max(xx) min(yy) max(yy)])
    hold off

    % Time series
    subplot(1,2,2)
    hold on
    grid on
    myfigpref
    fig_xytit('Time','Position','Time Series for Driven Duffing')
    plot(t(1:i),Y(1:i,1),'b','DisplayName','$x(t)$')
    plot(t(1:i),Y(1:i,2),'--r','DisplayName','$v(t)$')
    ylim([-bound bound])
    legend('location','ne','Interpreter','latex')
    hold off
    pause(0.01)

%     frame = getframe(gcf);
%     writeVideo(myWriter,frame);

end

% close(myWriter)

Plotting Reference Functions
function myfigpref
%   MYFIGPREF just makes figures pretty. Written by TGJChandler
%
%   Last edited: 01/01/2018 by TGJChandler
%
%   Comment by Tyler Jones: Thomas Chandler was my professor for math
%   415 (Applied Dynamical Systems, Chaos, and Modeling) @UW-Madison

set(0, 'DefaultAxesFontSize', 20)
set(0, 'DefaultAxesLineWidth', 2);
set(0, 'DefaultLineLineWidth', 2);
set(0, 'DefaultPatchLineWidth', .7);
set(0, 'DefaultLineMarkerSize', 6);

grid on;
box on;

h = gca;
h.TickLabelInterpreter='latex';
h.MinorGridAlpha=0.05;
h.GridAlpha=0.05;
h.FontSize=25;
h.LineWidth=2;

h = gcf;
h.Color = [1,1,1];
end
function fig_xytit(xlab, ylab, tit)
% FIG_XYTIT sets the current figure's xlabel, ylabel, and title
%   in latex format.
%
%   Last edited: 15/06/2021 by TGJChandler

if nargin<3
    tit = '';
end

xlabel(xlab,'interpreter','latex')
ylabel(ylab,'interpreter','latex')
title(tit,'interpreter','latex')
end
